
Know the Lingo - A Business Glossary to Syndicated Real Estate

This article will cover most of the terminology used in real estate investments, specifically as they apply to syndicated real estate investments.
The contents of this article are meant more as a reference guide vs. a more traditional article that is read from beginning to end.
Asset Class
Residential properties are divided in classes. The class that a property falls into is based on a combination of the tenant base, age of the property, and if the property has been well maintained.
Generally, a Class C property is older than three decades, the tenant base is working class or government subsidized housing, and the property is suffering from deferred maintenance and/or the property is in need of capital upgrades
A Class B property is usually less than 30 years old, the tenant base is working class or young professionals, and the property may be suffering from deferred maintenance and/or capital upgrades.
A Class A property is generally of recent construction, has a tenant base that is mostly professionals, and the property is up-to-date and well maintained. Properties in a higher class generally have more amenities (pool, fitness center, washer/dryer available in the units, etc.) as well.
Some real estate professionals or investors will reference asset classes below Class C properties, but normally anything below a Class C asset is going to be a distressed property. Distressed properties will have higher crime, low occupancy rates, higher delinquency rates, and/or significant maintenance issues. These properties may be referenced as C-, D, or even F Class properties. These three classes are fairly synonymous.
At times, you'll also see asset classes divided into additional categories. This usually happens when a General Partner is showing how improvements are going to reposition a property by updating the property. A General Partner will take a B Class property up to an A- or an A- to an A+.
Determining the class of a property is more art than science, so don't get too wrapped up in the details.
Capitalization Rate (Cap Rate)
The cap rate is calculated by dividing the Net Operating Income by the value of the property. This metric is important because cap rates determine what properties are worth, how a sponsor/General Partner projects future value of a property, and it determines how much financing a bank is willing to provide on a property.
We'll start with a simple cap rate table for a property that is earning $100,000 annually:

The lower the cap rate, the more valuable the property. During and after an economic downturn, you will usually see cap rates increase. An economy in recovery or nearing the top of a market cycle will see cap rates decline.
Banks will usually look at the average cap rates of other properties that have recently sold to determine how much they are willing to lend on a property.
This is where increasing the NOI is important because small gains in annual income yield larger gains for value:

For every additional $20,000 in NOI, the General Partner is adding $250,000 in value at an 8% cap rate.
We'll take this one step further to show how cap rates, leverage, and refinancing can make a syndicated real estate investment an extraordinary investment. The example below only focuses on NOI, cap rates, and how equity events can enhance an investment; it does not cover the preferred return or additional income that the investment would be earning each month/quarter:
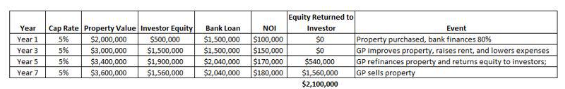
You can see that in Year 5 the investors receive all of their equity because the General Partner was able to enhance the NOI and then execute a refinance. During years 5, 6, and 7 the investment would continue paying a monthly/quarterly distribution even though the investors have been repaid all of their capital. In Year 7, investors receive an additional 3x their initial equity with the sale of the property.
This is a simplified model using very strong NOI improvements (although certainly not out of the realm of probability) to illustrate how improvements in NOI impact the returns for an investor.
Projected cap rates are also a good test to see how conservative a pro forma is. We generally like to see pro formas that hold cap rates fairly flat for two reasons.
First, by holding cap rates flat, the General Partner is able to show how the General Partner is going to add value to the property.
Second, by holding cap rates flat, a General Partner isn't counting on overall market improvement to add value for investors.
Below is a comparison that shows how assuming an improved cap rate can make an investment look really strong. For this scenario, assume that market cap rates are currently 6%:

Tweaking the cap rate by one percentage point yields an additional $500,000 in value. Without any justification for this addition, a General Partner is simply hoping for market factors to enhance the overall performance of the investment.
The exception to adjusting cap rates is when a property is bought at a discount (purchased at an 8% cap rate when the market cap rate is 6%). In this scenario, it is wholly appropriate to see a cap rate of 8% at purchase, but sold at the market cap rate of 6%.
Confidential Information Summary (CIS)
This is the document that is sent out by the General Partner or an intermediary to provide prospective investors with an overview of an investment. It can also be referred to as the Offering Memorandum. We've seen some CIS documents that are only a few pages with almost no detail, and we've seen them include a detailed pro forma, capital budget, stress test, and market analysis.
There are valid reasons for a shorter CIS, especially when investing in a fund. Generally in a fund, an investor commits capital before the investment has been identified. As a result, the CIS will include an overview of the type of investment the General Partners are looking for instead of a detailed analysis of an actual property.
When evaluating a real estate investment, we like the CIS to include as much detail as possible.
Equity
Equity is the amount of money that investors have invested in a property. Over time, most real estate investments experience an increase in equity. This happens for multiple reasons. First, real estate generally appreciates (or goes up in value) over time. There are some limited exceptions, but overall property values have slowly increased since before the signing of the Declaration of Independence. Second, equity increases as the bank is paid back. Most long-term loans require payback of interest (the bank's profit for lending money) and principal (the actual money lent). The bank's principal is the investor's equity. The investor pays back $1,000 in principal; the investor has increased their equity in the property by $1,000. Adding value to the property also increases equity. This value can be generated through anything that increases the property's revenue or decreases expenses. Common value-adds would be updating out-of-date amenities like appliances or investing in cost saving devices like exterior LED lighting. The last common way to generate equity in a property is to purchase the property at a discount. If a property valued at $1,000,000 is purchased for $800,000, the investor has automatically generated $200,000 in equity.
Equity is important because it represents the percentage of the property that is "owned" by the investor(s). In our opinion, every additional dollar in equity reduces the risk of the overall investment because additional equity generally enables investors to refinance debt on better terms, leverage additional debt if needed or desired, and yields more return upon the sale of the property.
Internal Rate of Return
IRR is one of the three critical tools we use to compare investments. We will not spend the time diving into how IRR is calculated – there are plenty of great sites that will explain this through a quick Google search. Instead, we are going to focus on how the IRR can be used to evaluate investments. Comparing IRRs helps you maximize your investment dollars. See the example below to understand how IRR changes based on the investment:

In this example, the distressed apartment complex has the highest IRR. We often see this when a distressed asset can be purchased at a steep discount.
A distressed asset can be one that is managed poorly and/or is in need of significant repairs/upgrades. It wouldn't have been able to pay a return initially because income from the property would have been reinvested into the property. If an investor was looking to maximize their investment, this would have been the best investment.
There are a lot of assumptions that are made when an IRR is produced. In the example above, the higher the IRR the more variables and potential risks that must be dealt with.
The distressed apartment complex will probably need significant capital invested to improve or repair the property, the tenant base is probably going to need to be changed, etc. We mention this not to dissuade potential investors, but to encourage investors to analyze the details behind the numbers to make sure that the General Partner can deliver.
IRRs are also easy to manipulate. We call this pencil whipping.
Take the distressed apartment complex as an example. If a General Partner wanted to improve the IRR, they could show a 3-year investment vs. the 5-year:

All that is occurring between these three scenarios is the date that the General Partner sells the property. The General Partner wouldn't be wrong to show a 3-year investment time frame, but it does significantly boost the IRR.
It wouldn't hurt to play around in Excel with the XIRR formula so that you understand how different scenarios move the IRR up and down.
A final note. We see IRR as directional, not as an absolute truth. There are so many variables and almost all investments extend out several years.
A lot can happen even in the three-year scenario above. If a General Partner boasts a 25% IRR, it should be viewed as an approximation.
Should the asset and the economy perform (approximately) as anticipated, we would expect to see an IRR between 22% and 28%. There are just too many variables to hold a General Partner to a precise IRR.
Investment Multiple
This is calculated by dividing the total distributions from the property by the capital invested in the property:

The investment multiple is the second of three metrics that helps an investor understand how the real estate investment will perform. The other two metrics are the IRR and the Net Cash Yield.
Leverage
Leverage is debt. It can also be referred to as financing. While this is probably obvious to most, we wanted to highlight it because there is so much conflicting information about good debt, bad debt, and being debt free.
The simplest way to understand this is to understand what debt means to an investment. It is possible to have too much debt on an investment, although we have never seen an instance where the financing on a property is so high that the debt payments make the investment insolvent.
Using more leverage (and less equity) increases the investor's return on an investment. It also increases the risk:

In Scenario A, the investor uses no debt. For every $1 invested, they make $0.10 annually. In Scenario B, the investor finances 80% of the investment. For every $1 invested, they make $0.22 annually, or over double the return.
In Scenario B, the investor has to pay $56,000 in interest each year to the bank. Should something occur with the property like a major sewer issue or should the economy go into recession and evictions rise, that $56,000 represents an additional level of burden (risk) in keeping the property profitable vs. Scenario A.
When it comes to investing, debt is neither good nor bad, it is simply a tool. Understanding how to use the tool responsibly is essential to good investing.
Net Cash Yield
Is the third metric that helps a real estate investor understand how an investment will perform. The net cash yield is the average cash that an investment will yield annually from distributions. It usually excludes the liquidation of the property.
Below is a table that helps illustrate how these three metrics correlate with one another:

Strong distributions usually mean that there is already limited opportunity to enhance value which is why you usually see a lower IRR accompanying a high net cash yield.
Net Operating Income (NOI)
This is the amount of cash that remains after the expenses are subtracted from the revenue. It usually excludes asset management fees (fees taken by the General Partner to manage the investment) and debt service (the cash needed to repay the loan).
Net Operating Income also excludes capital investments because these investments are generally seen as unique and infrequent.
Capital investments are different than repairs which are a part of NOI. Take flooring as an example. A stained carpet that needs to be replaced would be considered an expense if the replacement flooring was a similar quality carpet. However, most homeowners and tenants prefer tile or some type of wood flooring verse carpet, and they are willing to pay a premium for nicer flooring.
Replacing carpet with wood flooring would be an upgrade that would probably yield a higher monthly rent. This would make it a capital investment and it would not show up in the numbers for NOI.
NOI is important because it is the primary number that determines the value of a property. An increase to NOI usually translates to more money with each monthly or quarterly distribution, but it also is a critical factor in how the property is valued.
A $100,000 increase in NOI can increase the overall value of the property by several hundred thousand dollars. For more on this, refer back to Capitalization Rate.
Non-Recourse Financing
Non-recourse financing is a loan that is without recourse. Non-recourse debt is the standard when it comes to syndicated real estate investing, and it simply means that the only recourse the lender has is against the property or properties secured by the debt. Should the bank need to foreclose, the bank doesn't have recourse to go after the General Partners' other assets.
I'd hesitate to use the word never, but I'd be extremely cautious of a syndicated real estate investment with debt that is anything other than non-recourse. Non-recourse implies that the lender feels the asset and operator are both strong enough to warrant the risk of lending money with only the investment as collateral.
Preferred Return
The preferred return is the return that investors receive before the General Partner(s) can take a profit. We love the preferred return because it helps align the interests of the General Partners with the investors.
New investors often get too fixated on the preferred return. I'd much rather invest in a proven operator that has a low preferred return but a higher overall return than a proven operator that has a higher preferred return and a lower overall return.
Private Placement Memorandum (PPM)
This document covers the investment in detail. If the CIS was light on details, the PPM should provide the subsequent information needed to make an informed investment decision. It also includes risk factors to consider, provides a more detailed investment thesis, and details the purpose of the investment if the CIS doesn't.
Pro Forma
This is the forecasted financial performance of an investment, and the more detail given, the better. An example of a pro forma is provided below:

We get questions all the time from investors regarding how an investment is performing, and usually, all of the answers originate with the pro forma.
We'll do a deeper dive into the pro forma in a future article, but for now we wanted to provide a brief explanation and what one (a good one) looks like.
These are usually found within the Offering Memorandum (OM) which is also known as the Confidential Investment Summary (CIS). Usually, the pro forma is also included in the Private Placement Memorandum (PPM).
Profit Split
This explains how the profit will be split between General Partners and investors (also known as Limited Partners) once the investors receive their preferred return.
A profit split is shown as a ratio or fraction: 70/30. The first number represents the percentage of every dollar earned that goes to the investors and the second number is the percentage of every dollar earned that goes to the General Partners. We usually see a profit split of 70/30, 60/40, or 50/50.
Subscription Agreement
This document is signed by the investor and the Manager of the LLC or the General Partner. The subscription agreement details the ownership that the investor has in the entity that will be investing in the property. It generally highlights how many shares the investor is purchasing, the cost for each share, and it may include the total investment amount.
Waterfall
A waterfall is when the profit split changes. We see a waterfall structure on roughly half of the investments that we participate in. The waterfall usually looks something like this: the real estate investment pays a generous profit split (example: 70/30) until a predetermined Internal Rate of Return (IRR) is achieved (example: 15%). Once the Internal Rate of Return is achieved, the profit split moves in favor of the General Partner (example: 50/50).